Data Visualisation
Data Visualisation With Lobster. See Your Data. Gain New Insights.

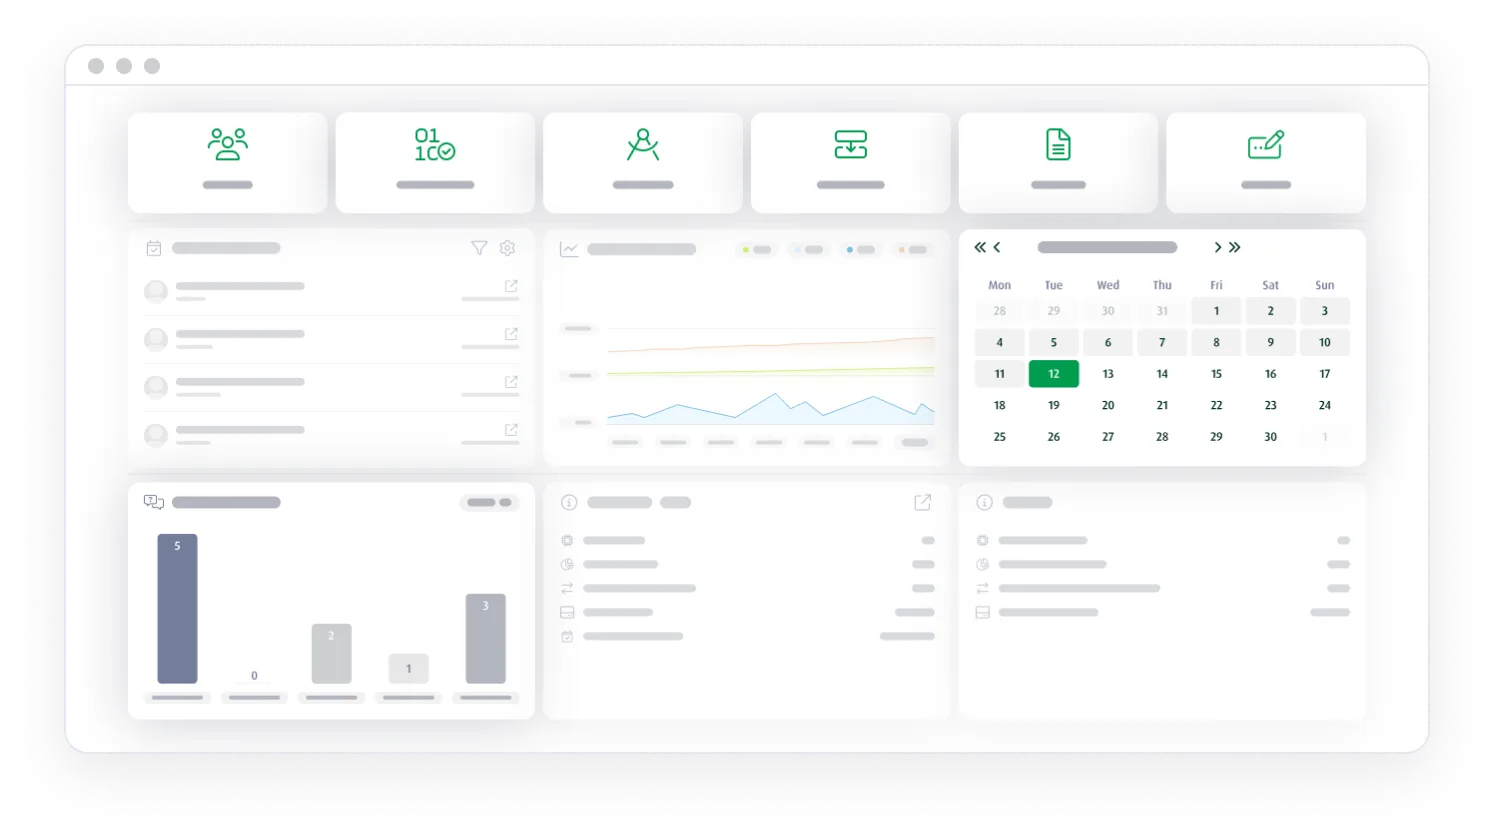
Build custom data models, design dashboards, automate reports, and create interactive portals – simply drag and drop. Turn your raw data into actionable insights for smarter, faster decisions.






6 Good Reasons for Data Visualisation. With Lobster.
Lorem ipsum dolor sit amet consectetur. Gravida lorem aenean libero at sit iaculis volutpat. Sit vestibulum cursus accumsan risus.
See Your Data.
Your Way.
Tailor data to meet your exact needs. Create personalised views for different users, apply filters, and sort and segment your data to focus on what matters most.
Dashboards That Do The Most.
Design dynamic, interactive dashboards with drag-and-drop simplicity. Choose from various chart styles and layouts, and monitor key metrics in real time – all while matching your branding.
Portals That Mean Business.
Share what’s important, securely. Customisable portals let you provide access to selected data for customers, partners, or team members, with control over who sees what.
Headline 3-Grid Boxes
Lorem ipsum dolor sit amet consectetur. Gravida lorem aenean libero at sit iaculis volutpat. Sit vestibulum cursus accumsan risus.
Reports on Repeat.
Let Lobster handle reporting for you. Schedule regular updates and automatic delivery to keep everyone informed while saving valuable time.
Insights in an Instant.
Stay ahead with instant insights. Real-time analytics allow you to spot trends as they happen, so you can act decisively and stay competitive.
Plug-And-Play Power.
Connect effortlessly. Lobster integrates with ERP, CRM, and other systems via 90+ pre-built connectors, supporting all common data formats and protocols.
Facts & Figures.
The Lobster Data Platform as a Data Visualisation Platform.
Configure Over Code.
Item #1
Lorem
Data Visualisation for Clear Decisions.
Our visualisation capabilities are designed to help you turn your data into actionable knowledge. Here’s how:
Customised Data Views.
Customise data views to create tailored data displays that cater to specific user groups. Users can filter and segment data based on unique requirements, ensuring the right information is accessible to the right people at the right time.
How this helps:
- Enable efficient data access tailored to different user needs.
- Streamline decision-making by presenting only the most relevant data.
Flexible Dashboards.
Experience the joy of using flexible dashboards to design interactive visualisations using various chart types, including bar charts, line charts, and pie charts. These dashboards can be customised to align with a company’s corporate identity, making them both functional and visually consistent with the brand.
How this helps:
- Enhance user experience with easy-to-understand data representations.
- Align visual content with branding, strengthening the company’s identity.
Portals.
Customer and data portals offer secure data release, so you can share specific datasets through secure online portals. Assign roles and access rights, ensuring that only authorised personnel can view or interact with the data.
How this helps:
- Provide controlled, secure access to sensitive data.
- Enhance collaboration and data sharing while maintaining confidentiality.
Reports & Analyses.
Automated reports and real-time analyses allow you to schedule reports that are generated and sent automatically at predefined times. Real-time data unlocks up-to-date analyses and dynamic dashboards, ensuring that businesses stay informed with the latest insights.
How this helps:
- Reduce manual effort by automating regular reports.
- Ensure decision-makers have access to the most current data.
Integration & Expandability.
Integration and expandability features connect your existing systems, such as ERP and CRM, seamlessly to the platform through pre-built connectors. The system supports all common data formats and protocols, making it easy to integrate with a variety of tools.
How this helps:
- Facilitate smooth integration with existing systems, reducing setup time.
- Ensure flexibility and scalability as the business grows and its needs evolve.
Trusted by Over 2,000 Companies.
Hear from businesses like yours, who have experienced the Lobster difference first-hand. Many have been with us for over a decade.

Achim Straile
“Not having to license every minor change was a huge selling point when choosing Lobster. Compared to our old system, Lobster simply offers a better product.”
Torsten Frantz
“We chose Lobster because the mapping is so transparent and easy to use. It’s really true that what you see is what you get.”

Frank Glienke
“Lobster made a huge difference for us, improving both the quality and efficiency of our logistics by automating our processes.”


Best-in-Class Solutions.
Customers love Lobster – and the proof is in the rankings. G2 reports consistently rate us as a top performer.
Data Visualisation With Lobster. In 3 Easy Steps.
Lorem ipsum dolor sit amet consectetur. Gravida lorem aenean libero at sit iaculis volutpat. Sit vestibulum cursus accumsan risus.
Join the Revolution.
Whether you’re a DIY enthusiast or prefer expert support, nothing stands in the way of seamless data visualisation.
Numbers Speak Louder Than Words. The Lobster Data World Simply Adds Up.
Item
More Data Processed Daily.
Item
Cost Savings.
Item
Faster Time to Market.
Let's Talk.
So Much More Than Data Visualisation.
Discover how the Lobster Data World goes beyond data visualisation.
Do Away With Data Silos. Connect & Integrate.
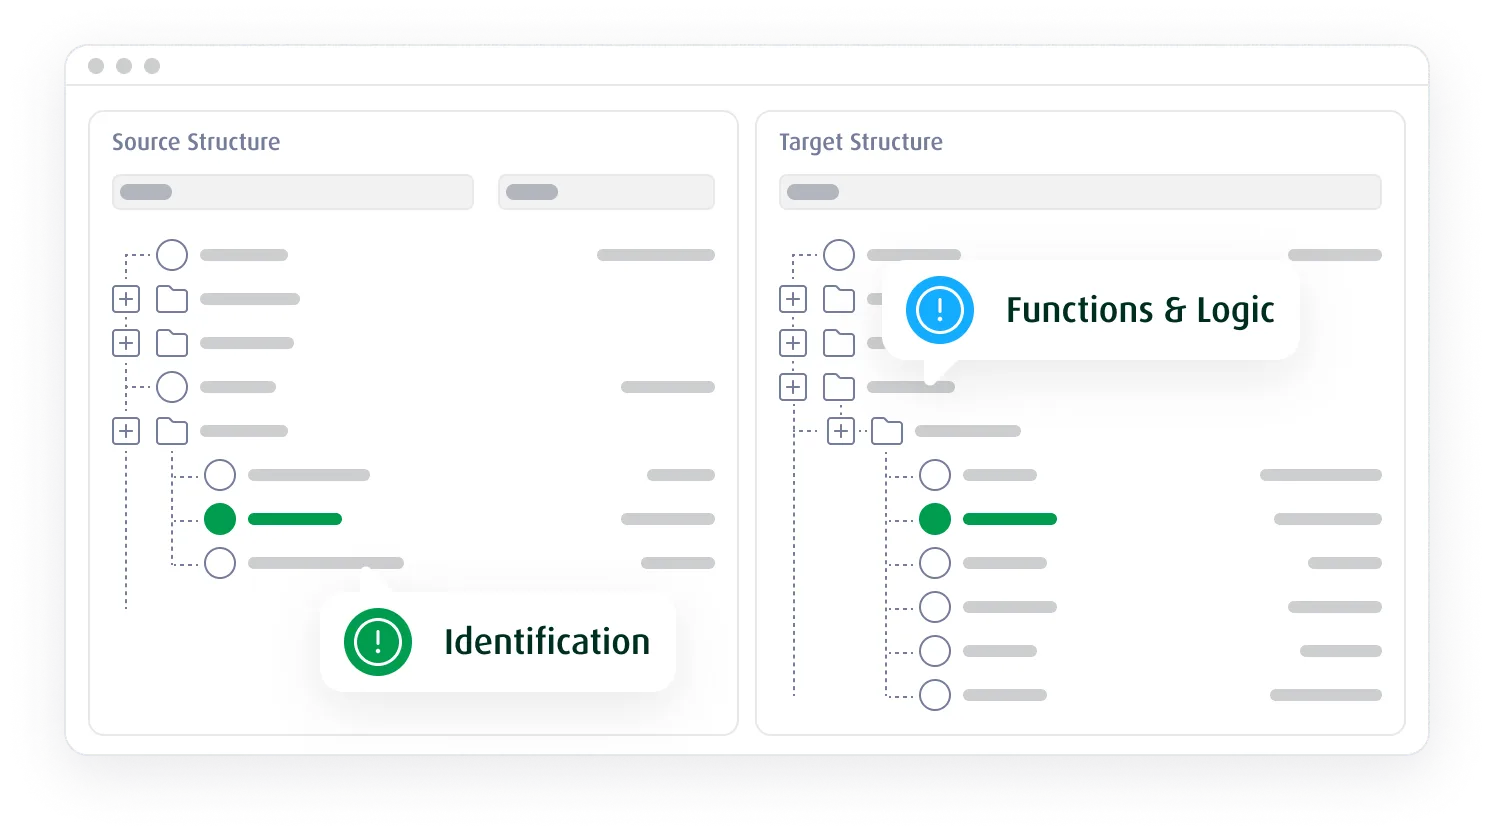
No matter where your data resides, Lobster will help you connect and combine it. Say goodbye to disparate, disjointed data and hello to transparent information flows that foster success.
Unlock Adaptability.
With API Management.
Create APIs that provide streamlined access to legacy data so partner and customer integrations can be utilised more effectively, ensuring compatibility with modern systems and workflows.
Streamline Your Supplier Relationships.
Unlock collaborative planning, forecasting, and replenishment and see how easy supplier relationship management can be. Think rapid onboarding, performance monitoring and real-time data exchange.
Lorem Ipsum Dolor
Lorem ipsum dolor sit amet consectetur. Vitae eget tempus risus erat aliquet. Morbi non sit orci vitae eu enim. Sed dui sed turpis diam consectetur velit nec morbi. Blandit nec bibendum euismod eu.
Good Questions, Already Answered.
What does data visualisation with Lobster cost?
Pricing is tailored to your needs. Choose from multiple editions and add-on services to match your requirements. Let’s chat about a custom solution for your business.
Do I need to know how to code to use Lobster’s visualisation tools?
Not at all. Lobster is a no-code platform, letting you create dashboards, reports, and portals effortlessly with drag-and-drop tools.
Can I integrate data from different sources?
Absolutely. Lobster offers over 90 pre-built connectors, making it easy to import data from a wide range of systems and formats.
Which companies is Lobster suitable for?
Lobster is perfect for businesses of all sizes and industries that want effective and efficient data visualisation.

